If there is free traffic flow in an unloaded network, the travel time t0 of a link can be determined from the link length and the free flow speed v0.
- Input: Length L [m]
- Input: Free flow speed, v0 [km/h]
- Result: Free flow travel time for t0 [s] = L • 3.6 / v0
The free flow speed v0-TSys of vehicles of a particular transport system can be lower than the free flow speed v0 of a link, because special speed limits might apply to these vehicles or because the vehicles cannot drive faster. The maximum speed of a PrT transport system vMax-TSys is an attribute of the link type.
Therefore, for speed v0-TSys and travel time t0-TSys applies:
- v0-TSys = MIN (v0, vMax-TSys)
- t0-TSys = L x 3,6 / v0-TSys
In a loaded network, travel time of a link is determined through a so-called volume-delay function (also known as capacity restraint function) which describes the correlation between the current traffic volume q and the capacity qmax. The result of the VD function is the travel time in the loaded network tcur.
- Input: Free flow travel time t0 [s]
- Input: Traffic volume q [car units/time interval]
- Input: Capacity qmax [car units/time interval]
- Input: VD function, for example BPR function from U.S. Bureau of Public Roads
- Result: Current in-vehicle time in the loaded network, for example
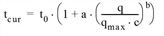 (dependent on VD function type)
- Result: Current travel time of a T-Sys = MAX (tcur, t0-TSys)
The Image 8 illustrates how speeds vcur of two PrT transport systems develop depending on the volume.
|
Link type Motorway
|
Link v0 =130 km/h |
|
|
Free traffic flow
|
|
|
|
partially linked traffic flow
|
|
|
|
linked traffic flow
|
|
|
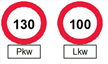
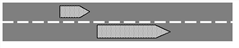
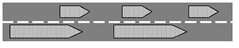
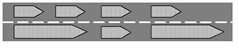
Image 8: Example for the different speeds of two PrT transport systems depending on the volume
